Scenes / workflows / pipeline-board / pipeline-board--metrics
Pipeline conversion
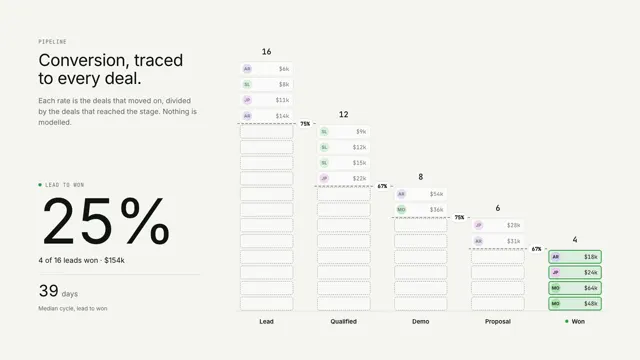
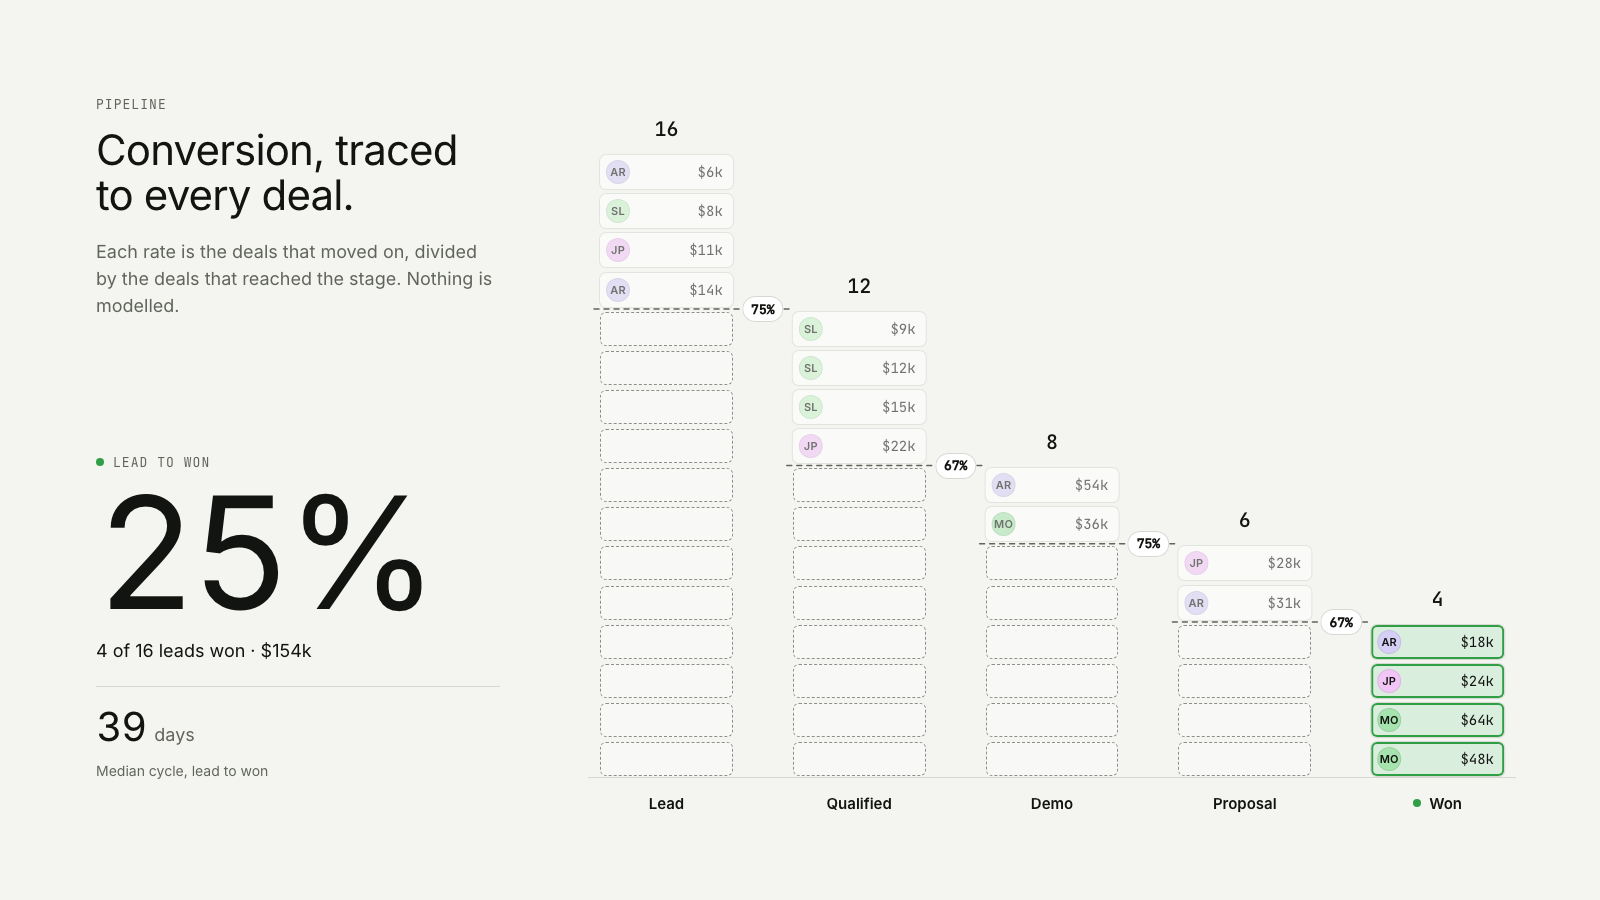
Deal cards slide across stage by stage and stack into a stepped chart, so every conversion rate and the lead-to-won figure come from the cards that moved.
The metrics take on Pipeline board: same story, built for a different job on the page.
Drawn in Outline · follows any look See the matched set →
With Claude Code
With the skill installed, paste this in your project.
Use the site-motion skill to make the "pipeline-board--metrics" scene for our site, in our brand.
Read our design tokens from this project (or run `site-motion theme <our url>`), write the content JSON with our real product nouns and numbers, then render mp4, webm and a poster. Check the loop seam before you finish.
From the command line
Draft your tokens, then copy the scene into your project. The first scene you add sets your site's look; every scene after it follows.
node bin/site-motion.mjs theme https://yoursite.com --out brand.json
node bin/site-motion.mjs add pipeline-board--metrics --tokens brand.json
Your brand, as tokens
The theme playing above, as a token file the CLI and the skill accept.
content.json, the words in this scene
{
  "title": "Pipeline conversion",
  "label": "A quarter's pipeline read as numbers. Sixteen deal cards, each with an owner's initials and a value, stream into the Lead column and stack into a bar. Stage by stage, the deals that advanced slide right into the next column and leave a dashed outline behind, so each column becomes a step of a falling bar chart: 16 leads, 12 qualified, 8 demos, 6 proposals and 4 won. The conversion between each pair of stages appears in the gap: 75%, 67%, 75% and 67%. On the left, the lead-to-won rate steps down with every move and lands on 25%, with 4 of 16 leads won worth $154k and a median cycle of 39 days from lead to won.",
  "eyebrow": "Pipeline",
  "heading": "Conversion, traced\nto every deal.",
  "sub": "Each rate is the deals that moved on, divided by the deals that reached the stage. Nothing is modelled.",
  "format": {
    "prefix": "$",
    "suffix": "k"
  },
  "stages": [
    "Lead",
    "Qualified",
    "Demo",
    "Proposal",
    "Won"
  ],
  "cards": [
    {
      "id": "northwind",
      "title": "Northwind Logistics rollout",
      "owner": "Maya Ortiz",
      "value": 48,
      "tag": "Expansion",
      "stage": 4,
      "days": 41
    },
    {
      "id": "riverbend",
      "title": "Riverbend Credit Union",
      "owner": "Maya Ortiz",
      "value": 64,
      "tag": "Security review",
      "stage": 4,
      "days": 55
    },
    {
      "id": "harbor",
      "title": "Harbor Analytics upgrade",
      "owner": "Jon Park",
      "value": 24,
      "tag": "Upsell",
      "stage": 4,
      "days": 31
    },
    {
      "id": "quarry",
      "title": "Quarry Outdoor wholesale",
      "owner": "Ana Ruiz",
      "value": 18,
      "tag": "Partner",
      "stage": 4,
      "days": 37
    },
    {
      "id": "pinecrest",
      "title": "Pinecrest Hotels renewal",
      "owner": "Ana Ruiz",
      "value": 31,
      "tag": "Renewal",
      "stage": 3
    },
    {
      "id": "atlas",
      "title": "Atlas Property Management",
      "owner": "Jon Park",
      "value": 28,
      "tag": "Outbound",
      "stage": 3
    },
    {
      "id": "fieldstone",
      "title": "Fieldstone Clinics, 40 seats",
      "owner": "Maya Ortiz",
      "value": 36,
      "tag": "Inbound",
      "stage": 2
    },
    {
      "id": "lumen",
      "title": "Lumen Schools district",
      "owner": "Ana Ruiz",
      "value": 54,
      "tag": "Public sector",
      "stage": 2
    },
    {
      "id": "orbit",
      "title": "Orbit Freight onboarding",
      "owner": "Jon Park",
      "value": 22,
      "tag": "Outbound",
      "stage": 1
    },
    {
      "id": "meadow",
      "title": "Meadow Health trial",
      "owner": "Sam Lee",
      "value": 15,
      "tag": "Trial",
      "stage": 1
    },
    {
      "id": "brightline",
      "title": "Brightline Dental Group",
      "owner": "Sam Lee",
      "value": 12,
      "tag": "Inbound",
      "stage": 1
    },
    {
      "id": "kettle",
      "title": "Kettle Coffee franchise",
      "owner": "Sam Lee",
      "value": 9,
      "tag": "Partner",
      "stage": 1
    },
    {
      "id": "wren",
      "title": "Wren Legal",
      "owner": "Ana Ruiz",
      "value": 14,
      "tag": "Referral",
      "stage": 0
    },
    {
      "id": "slate",
      "title": "Slate Roofing Co.",
      "owner": "Jon Park",
      "value": 11,
      "tag": "Outbound",
      "stage": 0
    },
    {
      "id": "juniper",
      "title": "Juniper Bakeries",
      "owner": "Sam Lee",
      "value": 8,
      "tag": "Inbound",
      "stage": 0
    },
    {
      "id": "cedar",
      "title": "Cedar & Pine Studio",
      "owner": "Ana Ruiz",
      "value": 6,
      "tag": "Referral",
      "stage": 0
    }
  ],
  "focal": "{from} to {to}",
  "result": "{won} of {entered} leads won · {value}",
  "cycle": {
    "unit": "days",
    "label": "Median cycle, lead to won"
  }
}
Files
default themeRendered frame-exact. For your brand, run the command on the left.
embed snippet
<iframe src="/pipeline-board--metrics.html" title="Pipeline conversion" style="width:100%;aspect-ratio:16/9;border:0" loading="lazy"></iframe>
More ways to show this
the same story, one per job on the page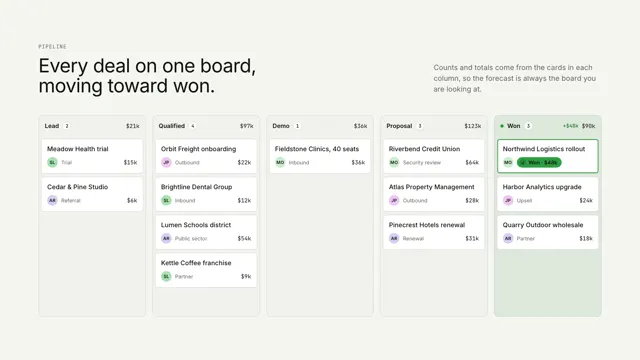
Related scenes
all scenes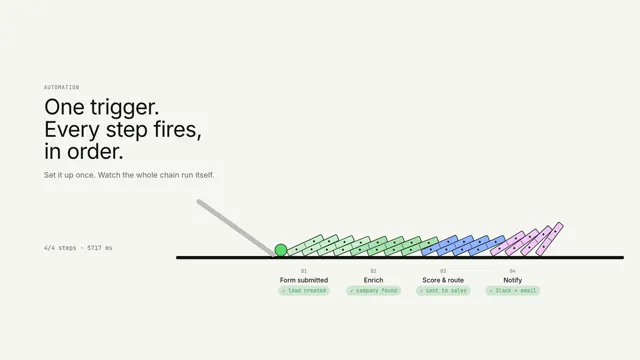
One trigger, every step
One trigger tips a chain of dominoes; each step lights as the wave reaches it.
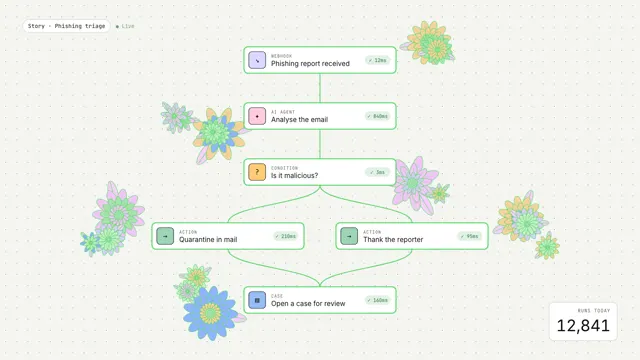
Workflow in bloom
An event runs through a workflow graph and each step blooms into generative flowers.
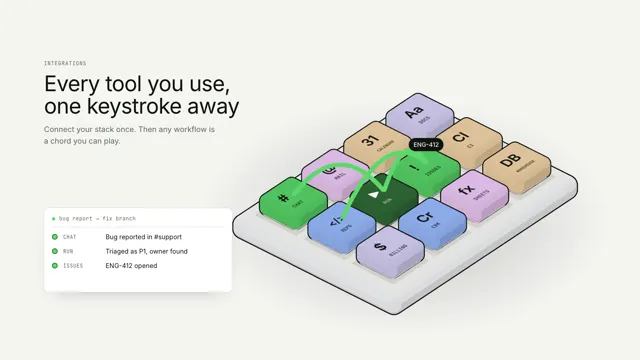
Every tool, one keystroke away
Every integration is a key on one isometric macro pad; a workflow is played as a chord, keys pressing in turn while a run log types each step.