Scenes / metrics / grain-tally / grain-tally--proof
Teams by region, poured into jars
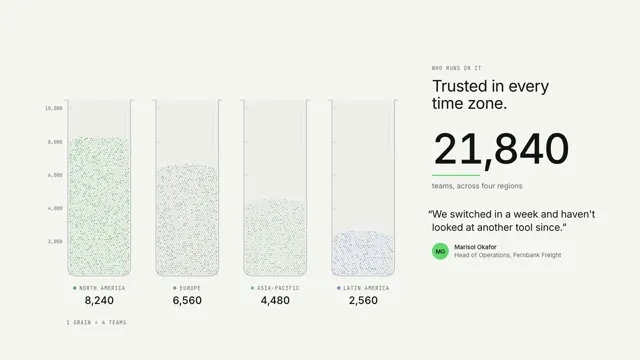
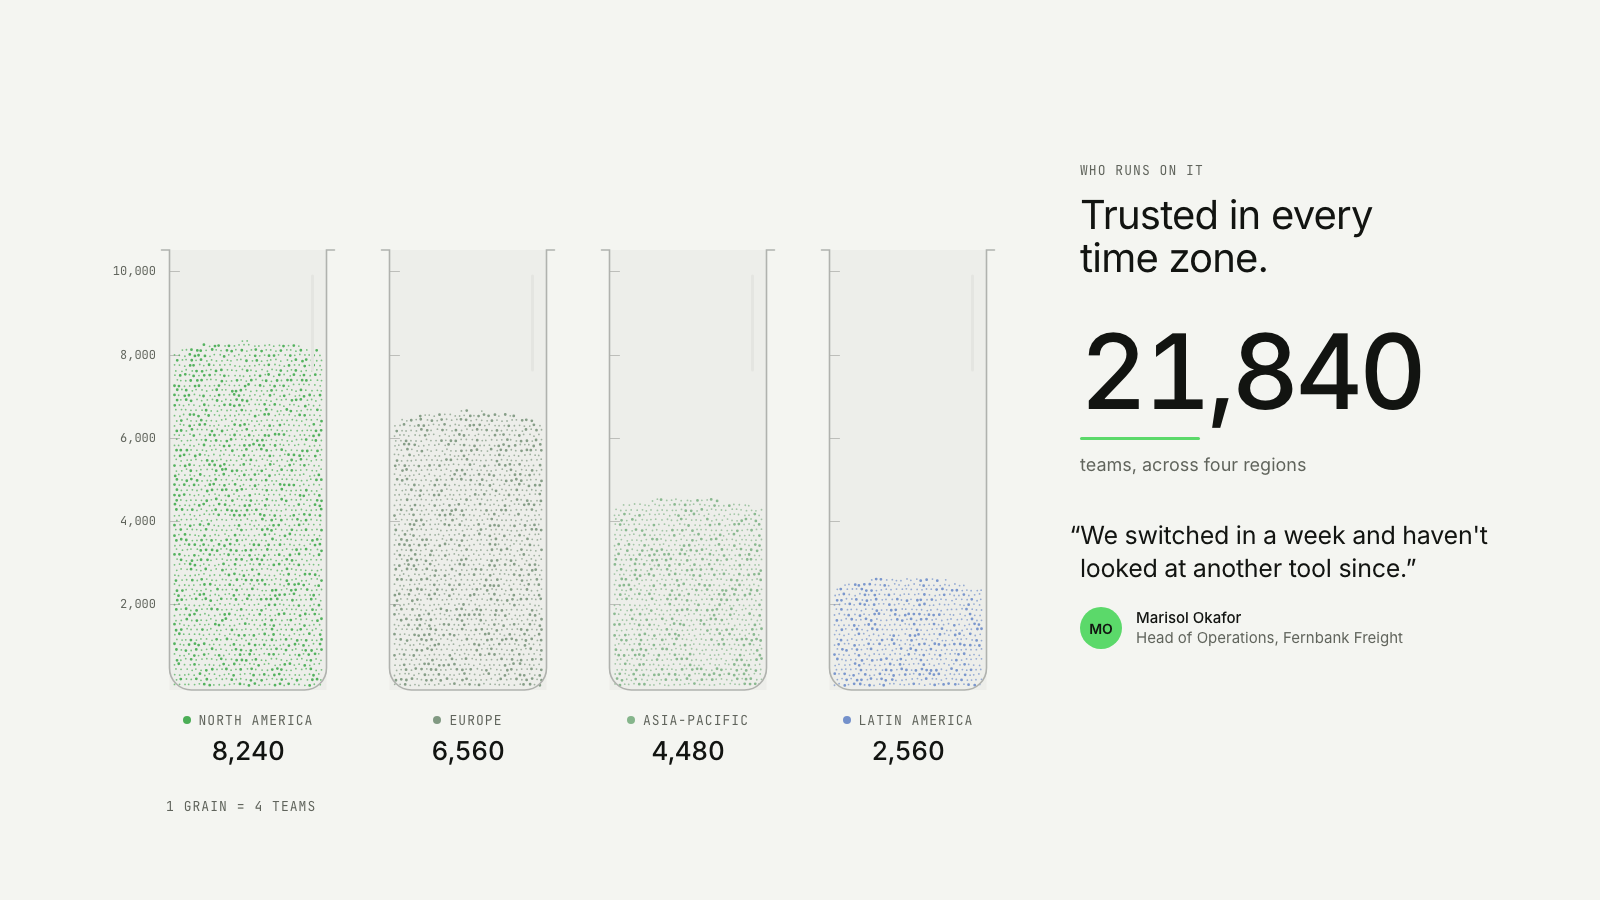
Grains of real customers pour into one glass jar per region, and the total of teams served is read off the four fill levels beside a customer's quote.
The proof take on The number, made of the work: same story, built for a different job on the page.
Drawn in Field · follows any look See the matched set →
With Claude Code
With the skill installed, paste this in your project.
Use the site-motion skill to make the "grain-tally--proof" scene for our site, in our brand.
Read our design tokens from this project (or run `site-motion theme <our url>`), write the content JSON with our real product nouns and numbers, then render mp4, webm and a poster. Check the loop seam before you finish.
From the command line
Draft your tokens, then copy the scene into your project. The first scene you add sets your site's look; every scene after it follows.
node bin/site-motion.mjs theme https://yoursite.com --out brand.json
node bin/site-motion.mjs add grain-tally--proof --tokens brand.json
Your brand, as tokens
The theme playing above, as a token file the CLI and the skill accept.
content.json, the words in this scene
{
  "title": "Teams by region, poured into jars",
  "label": "Four glass jars stand side by side, one per region: North America, Europe, Asia-Pacific and Latin America. A stream of grains pours into each jar from above, every grain four teams, and the jars fill to different levels against a shared scale marked every 2,000 teams. Under each jar its count lands as the last grain does: 8,240, 6,560, 4,480 and 2,560. Beside the jars, the total read from all four, 21,840 teams, and a quote from Marisol Okafor, Head of Operations at Fernbank Freight: we switched in a week and haven't looked at another tool since. Then the jar floors open, the grains fall through, and the pour begins again.",
  "eyebrow": "Who runs on it",
  "heading": "Trusted in every\ntime zone.",
  "perGrain": 4,
  "legend": "1 grain = {per} teams",
  "unit": "teams, across four regions",
  "tick": 2000,
  "sources": [
    {
      "name": "North America",
      "count": 8240
    },
    {
      "name": "Europe",
      "count": 6560
    },
    {
      "name": "Asia-Pacific",
      "count": 4480
    },
    {
      "name": "Latin America",
      "count": 2560
    }
  ],
  "quote": "“We switched in a week and haven't looked at another tool since.”",
  "person": {
    "name": "Marisol Okafor",
    "initials": "MO",
    "role": "Head of Operations",
    "company": "Fernbank Freight"
  }
}
Files
default themeRendered frame-exact. For your brand, run the command on the left.
embed snippet
<iframe src="/grain-tally--proof.html" title="Teams by region, poured into jars" style="width:100%;aspect-ratio:16/9;border:0" loading="lazy"></iframe>
More ways to show this
the same story, one per job on the page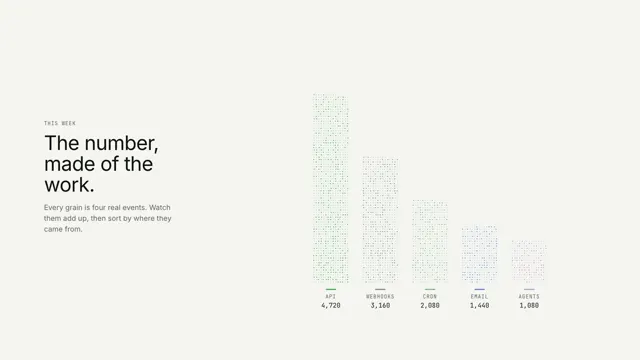
Related scenes
all scenes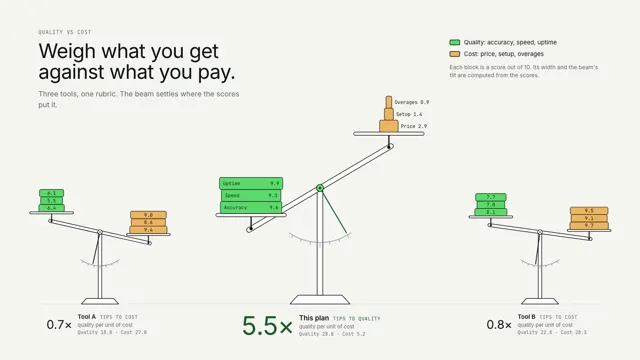
Quality against cost
Quality and cost blocks land on three pan balances; the rivals sag toward cost while ours tips to quality and settles, each tilt computed from the scores.
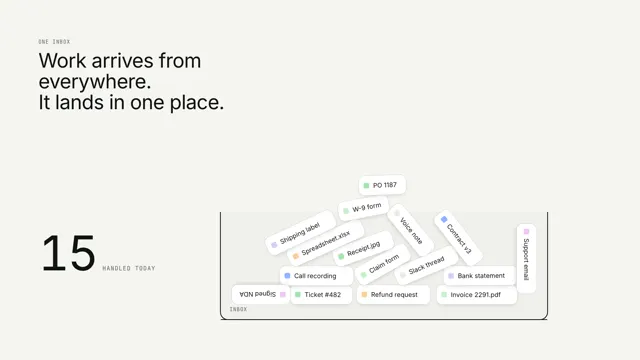
Everything lands in one place
Work items from everywhere fall into one tray with real physics while a counter tallies them.
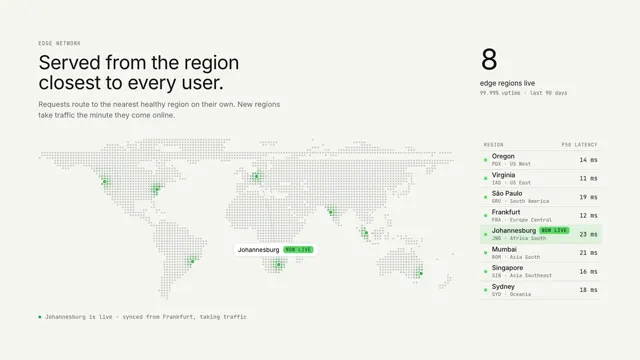
Coverage map
A dot-matrix world map where every region glows with live traffic, and a new region comes online with a ripple across the continents.