Scenes / routing / galton-router / galton-router--metrics
Routing mix
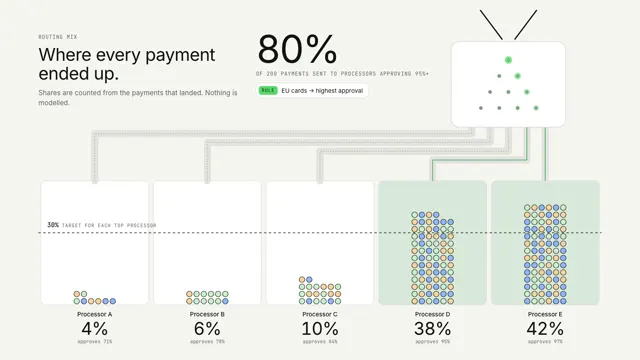
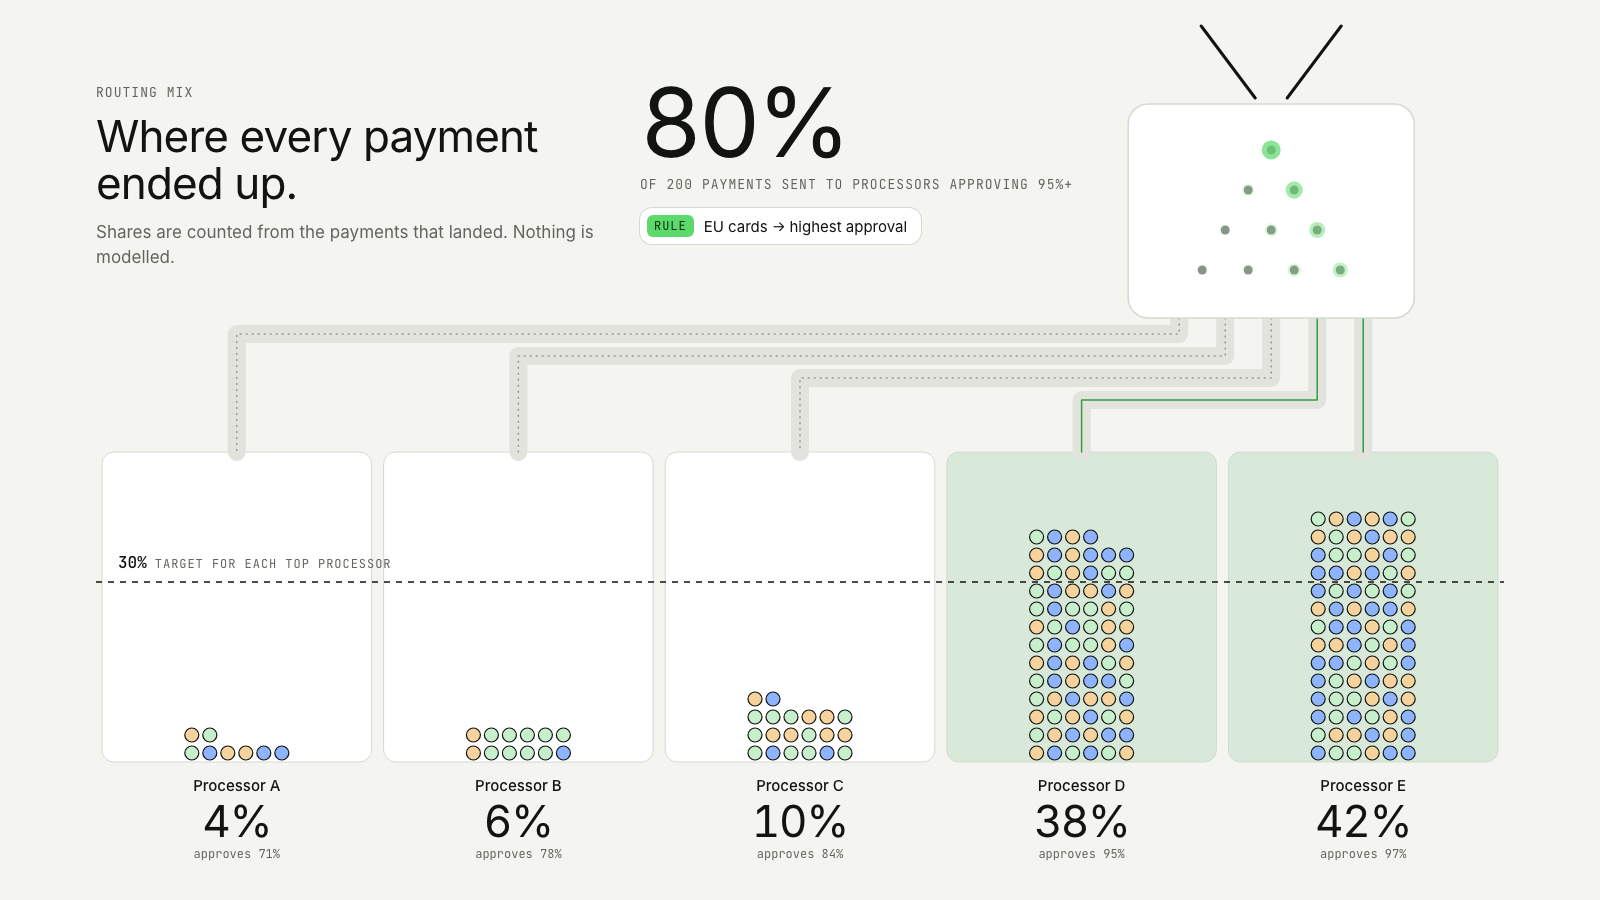
Payments drop through a small pegboard and ride their tracks into full-width bins, so each route's share is counted from the payments that landed.
The metrics take on Smart routing: same story, built for a different job on the page.
Drawn in Ink · follows any look See the matched set →
With Claude Code
With the skill installed, paste this in your project.
Use the site-motion skill to make the "galton-router--metrics" scene for our site, in our brand.
Read our design tokens from this project (or run `site-motion theme <our url>`), write the content JSON with our real product nouns and numbers, then render mp4, webm and a poster. Check the loop seam before you finish.
From the command line
Draft your tokens, then copy the scene into your project. The first scene you add sets your site's look; every scene after it follows.
node bin/site-motion.mjs theme https://yoursite.com --out brand.json
node bin/site-motion.mjs add galton-router--metrics --tokens brand.json
Your brand, as tokens
The theme playing above, as a token file the CLI and the skill accept.
content.json, the words in this scene
{
  "title": "Routing mix",
  "label": "A day's routing read as a distribution. In the top right corner a small pegboard drops 200 payments one at a time; each bounces left or right off four rows of pegs and leaves through one of five exits onto its own track, which carries it across the page into a wide bin. The payments stack in the bins as dots and build a histogram over the full width. Under each bin the share is counted from the payments that landed: Processor A 4%, Processor B 6%, Processor C 10%, Processor D 38% and Processor E 42%. A dashed line marks the 30% target for each top processor; D and E rise above it. At the top, the share sent to processors that approve 95% or more settles at 80% of 200 payments, under the rule EU cards to highest approval.",
  "eyebrow": "Routing mix",
  "heading": "Where every payment\nended up.",
  "sub": "Shares are counted from the payments that landed. Nothing is modelled.",
  "bins": [
    {
      "name": "Processor A",
      "note": "approves 71%",
      "share": 4
    },
    {
      "name": "Processor B",
      "note": "approves 78%",
      "share": 6
    },
    {
      "name": "Processor C",
      "note": "approves 84%",
      "share": 10
    },
    {
      "name": "Processor D",
      "note": "approves 95%",
      "share": 38,
      "good": true
    },
    {
      "name": "Processor E",
      "note": "approves 97%",
      "share": 42,
      "good": true
    }
  ],
  "rule": {
    "label": "EU cards → highest approval"
  },
  "rateLabel": "of {n} payments sent to processors approving 95%+",
  "target": {
    "share": 30,
    "label": "target for each top processor"
  },
  "count": 200,
  "spawnUntil": 7.4
}
Files
default themeRendered frame-exact. For your brand, run the command on the left.
embed snippet
<iframe src="/galton-router--metrics.html" title="Routing mix" style="width:100%;aspect-ratio:16/9;border:0" loading="lazy"></iframe>
More ways to show this
the same story, one per job on the page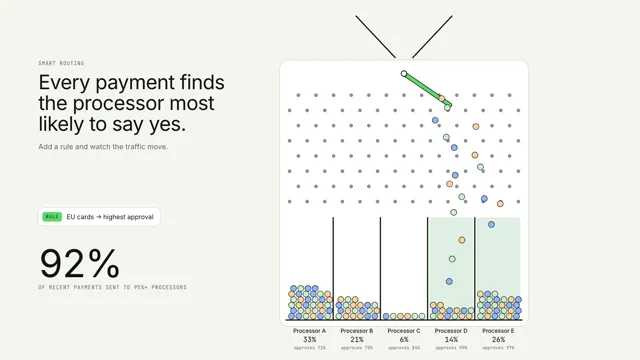
Related scenes
all scenes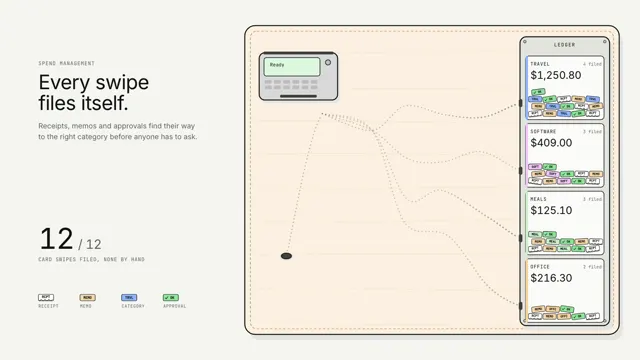
Spend that sorts itself
Every card swipe drops its paperwork on the table, and a line of ants carries each crumb down its own pheromone trail to the right ledger slot.
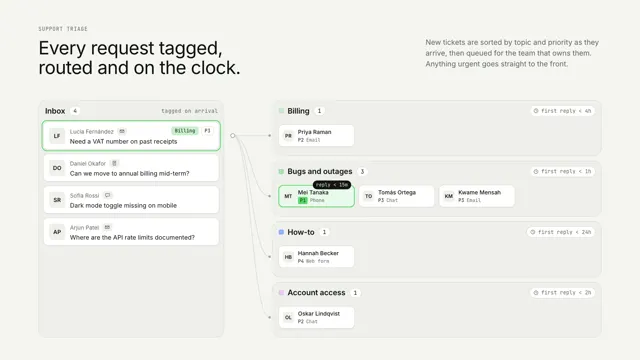
Inbox triage
Incoming requests are tagged and routed into team queues with SLA timers, and one urgent item jumps to the front of its line.
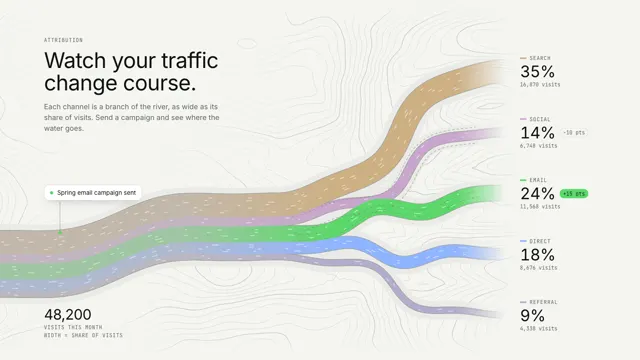
Traffic, by channel
Traffic is a river on a contour map, split into one branch per channel as wide as its share; a campaign surge widens one branch while its neighbours narrow.