Product demos / dashboard-push
See the week that mattered
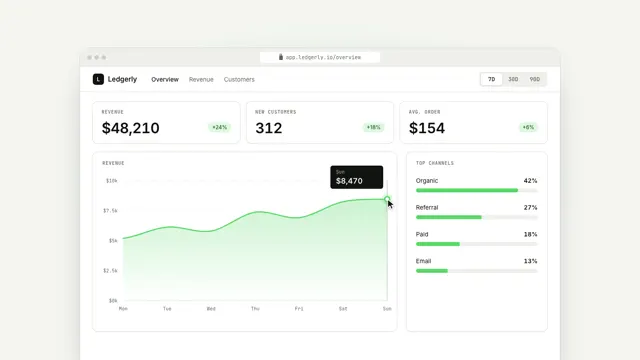
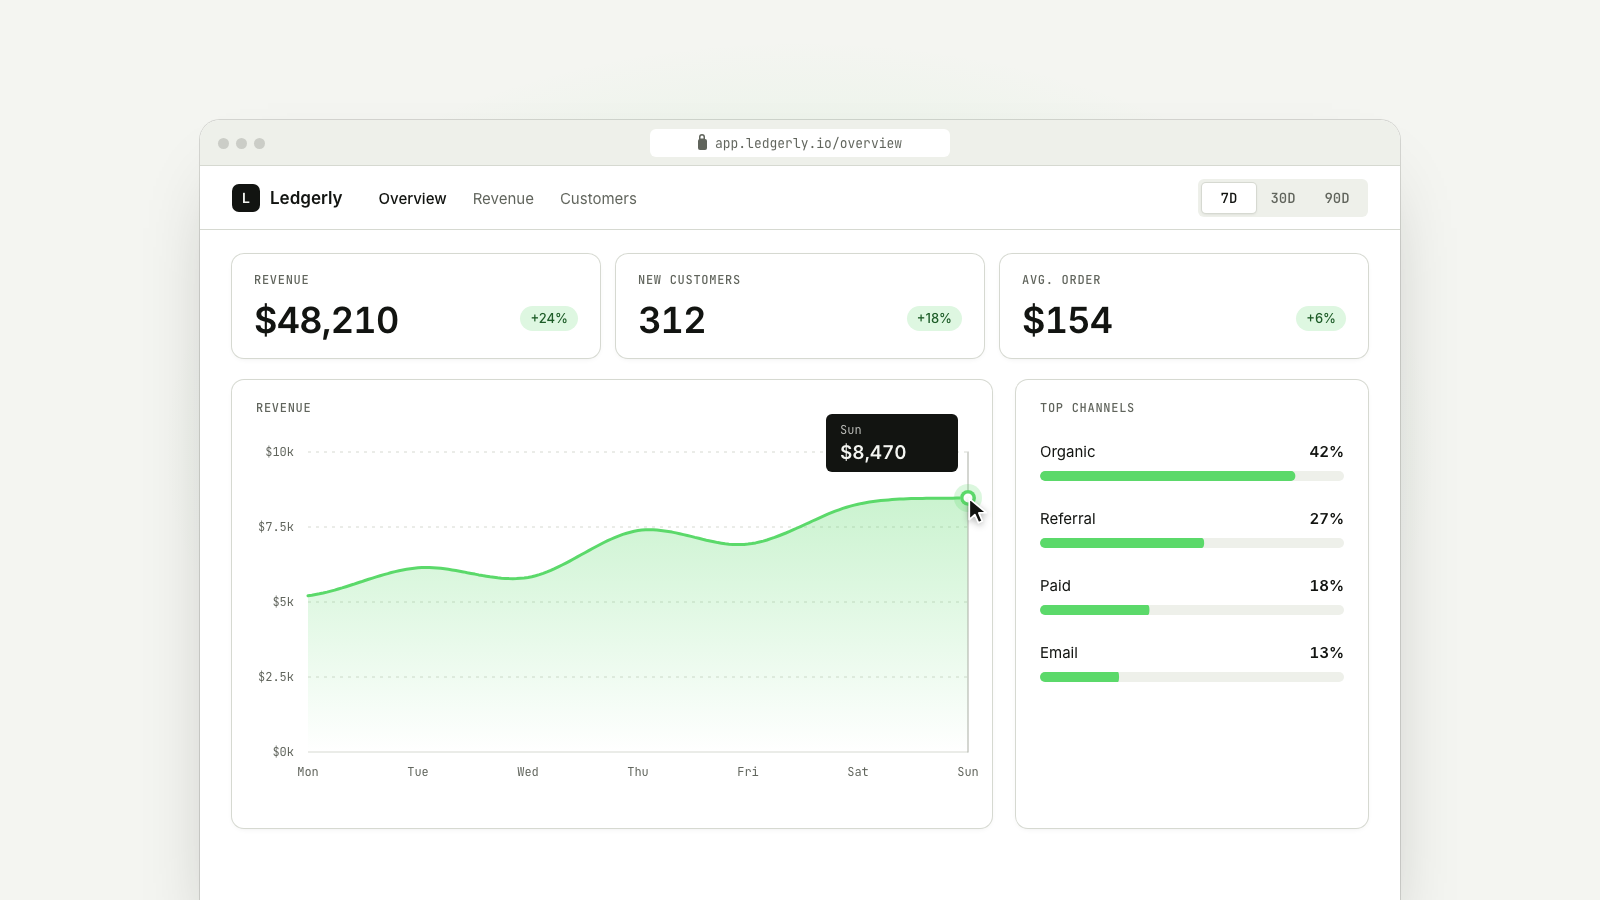
A real dashboard: the revenue figure builds from the line as it draws, the cursor scrubs the chart, the camera pushes in on the best day, and 30D morphs the whole view.
Drawn in Soft UI · follows any look See the matched set →
With Claude Code
With the skill installed, paste this in your project.
Use the site-motion skill to make the "dashboard-push" scene for our site, in our brand.
Read our design tokens from this project (or run `site-motion theme <our url>`), write the content JSON with our real product nouns and numbers, then render mp4, webm and a poster. Check the loop seam before you finish.
From the command line
Draft your tokens, then copy the scene into your project. The first scene you add sets your site's look; every scene after it follows.
node bin/site-motion.mjs theme https://yoursite.com --out brand.json
node bin/site-motion.mjs add dashboard-push --tokens brand.json
Your brand, as tokens
The theme playing above, as a token file the CLI and the skill accept.
content.json, the words in this scene
{
  "title": "See the week that mattered",
  "label": "A revenue dashboard in a browser window. The revenue line draws from Monday to Sunday and the revenue total builds from it to $48,210. A cursor scrubs along the line showing each day's value, the camera moves in on Sunday, the best day, marked up 24 percent on last week, then pulls back. The cursor switches the range to 30 days and every chart, figure and channel bar changes to the month, then back to the week.",
  "url": "app.ledgerly.io/overview",
  "brand": {
    "text": "L",
    "name": "Ledgerly"
  },
  "tabs": [
    "Overview",
    "Revenue",
    "Customers"
  ],
  "ranges": [
    "7D",
    "30D",
    "90D"
  ],
  "chartTitle": "Revenue",
  "currency": "$",
  "axis": [
    0,
    10000
  ],
  "week": {
    "labels": [
      "Mon",
      "Tue",
      "Wed",
      "Thu",
      "Fri",
      "Sat",
      "Sun"
    ],
    "values": [
      5210,
      6140,
      5820,
      7380,
      6930,
      8260,
      8470
    ],
    "kpis": [
      {
        "label": "Revenue",
        "delta": "+24%"
      },
      {
        "label": "New customers",
        "value": 312,
        "delta": "+18%"
      },
      {
        "label": "Avg. order",
        "value": 154,
        "prefix": "$",
        "delta": "+6%"
      }
    ]
  },
  "month": {
    "labels": [
      "Oct 12",
      "Oct 19",
      "Oct 26",
      "Nov 2",
      "Nov 9"
    ],
    "values": [
      4120,
      4380,
      4050,
      4610,
      4890,
      4470,
      4720,
      5030,
      5280,
      4960,
      5340,
      5610,
      5190,
      5480,
      5820,
      5550,
      5910,
      6240,
      5870,
      6180,
      6530,
      6110,
      6420,
      6790,
      6380,
      6930,
      7260,
      6870,
      8260,
      8470
    ],
    "kpis": [
      {
        "label": "Revenue",
        "delta": "+11%"
      },
      {
        "label": "New customers",
        "value": 1284,
        "delta": "+9%"
      },
      {
        "label": "Avg. order",
        "value": 146,
        "prefix": "$",
        "delta": "+2%"
      }
    ]
  },
  "channelsTitle": "Top channels",
  "channels": [
    {
      "name": "Organic",
      "week": 42,
      "month": 38
    },
    {
      "name": "Referral",
      "week": 27,
      "month": 31
    },
    {
      "name": "Paid",
      "week": 18,
      "month": 20
    },
    {
      "name": "Email",
      "week": 13,
      "month": 11
    }
  ],
  "best": "Best day this week",
  "bestDelta": "↑ 24% on last Sunday",
  "cursor": [
    {
      "at": 3.5,
      "to": "pt-1",
      "anchor": [
        0.5,
        0.5
      ]
    },
    {
      "at": 4.15,
      "to": "pt-3",
      "move": 0.6
    },
    {
      "at": 4.8,
      "to": "pt-6",
      "move": 0.6
    },
    {
      "at": 8.55,
      "to": "range-1",
      "click": true
    },
    {
      "at": 11.05,
      "to": "range-0",
      "click": true
    },
    {
      "at": 13.2,
      "to": [
        1260,
        862
      ]
    }
  ],
  "camera": [
    {
      "at": 5,
      "dur": 1.25,
      "zoom": 1.85,
      "focus": "pt-6",
      "offset": [
        -60,
        70
      ]
    },
    {
      "at": 7.05,
      "dur": 1.15,
      "zoom": 1
    }
  ],
  "times": {
    "draw": 0.25,
    "hover": [
      3,
      7.4
    ],
    "annotate": [
      5.75,
      7
    ]
  }
}
Files
default themeRendered frame-exact. For your brand, run the command on the left.
embed snippet
<iframe src="/dashboard-push.html" title="See the week that mattered" style="width:100%;aspect-ratio:16/9;border:0" loading="lazy"></iframe>
More product demos
all demos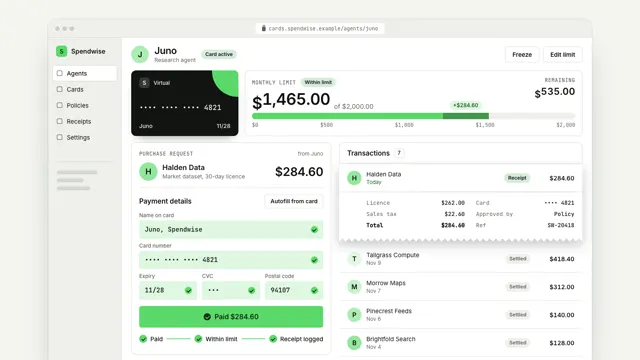
Give your agent a card with a limit
An agent's virtual card at work: a purchase request comes in, the checkout autofills with a masked card, the limit meter moves by exactly the amount and the receipt joins the list.
Invite your team in one step
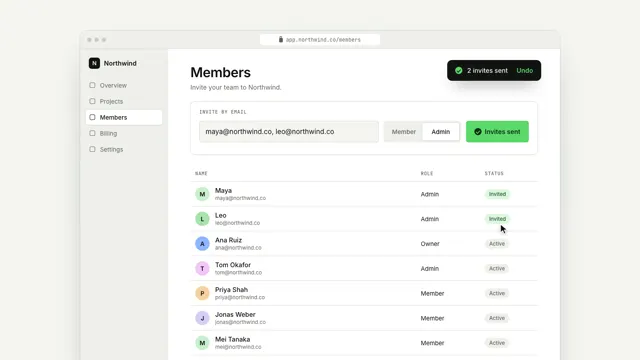
A real product screen: the cursor types two emails, picks a role and sends; the camera pulls back as the team grows.
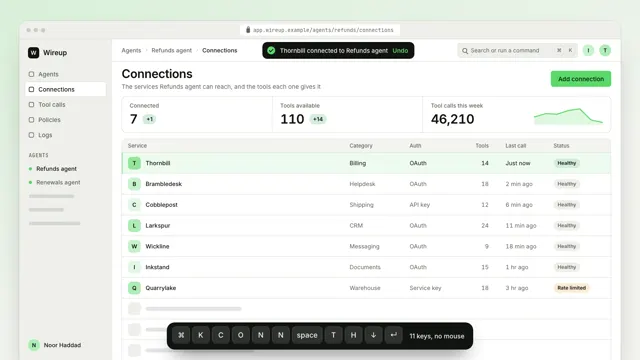
Connect a service without leaving the keyboard
A workspace dims under a command palette: each key filters the list, Enter runs the right action and the result lands in the screen behind, no mouse needed.