Scenes / scale / coverage-map / coverage-map--metrics
Coverage map, by the numbers
Edge regions ranked by latency in a live table, re-sorting as a sweep crosses the map inset, with the global p50 computed from the rows.
The metrics take on Coverage map: same story, built for a different job on the page.
Drawn in Field · follows any look See the matched set →
A Pro scene plays here as a video. With Pro you get its source, and it takes your brand and any look like every other scene.
A site-motion Pro scene
ProWatching it here is free. Its source ships with site-motion Pro, not the MIT repo, and with it the scene takes your brand and any look. One email when Pro opens, with this scene in it.
Start free today
MITThe closest free scene: Edge inference. It installs from the open-source repo and follows the same brand and look.
node bin/site-motion.mjs add iso-blocks --tokens brand.json
More ways to show this
the same story, one per job on the page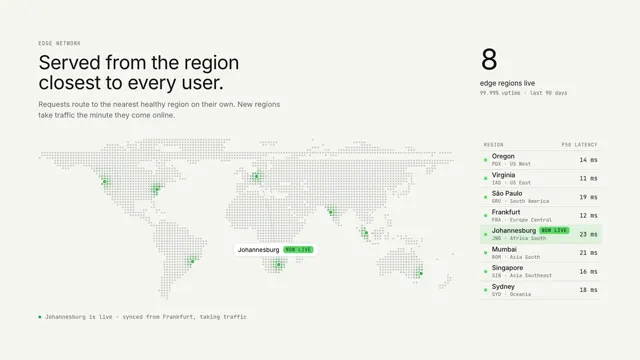
Related scenes
all scenes
Deploy liftoff
Each build-log line inflates a hot-air balloon by its share; when the health check passes it lifts off flying an online pennant.

Edge inference
Isometric blocks with live data on their faces rise over a tiled floor.
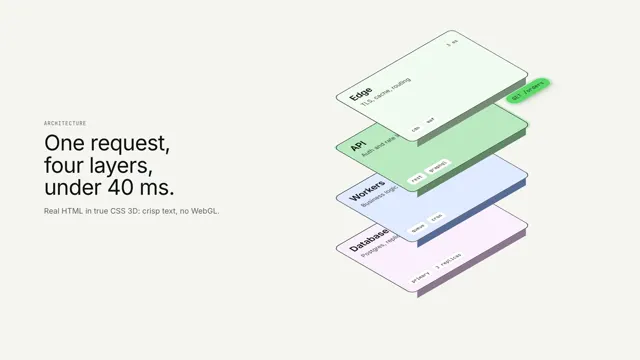
The stack, in 2.5D
Real HTML layers lift apart in 2.5D while a request drops through the stack.